Recently I looked into writing a custom linter for an open-source project called defsec. We had a fairly unique problem with an all-too-frequent bug. We decided if we could catch this type of bug at development time with a linter, we could not only fix things faster (instead of waiting for an integration test to fail), but we could also consistently prevent the bug from happening in the first place. I was pleasantly surprised to discover that this was not only trivially possible, but an all round pleasant experience…
Useful Packages
One of the most celebrated aspects of the Go language is its tooling, and perhaps one of the reasons this tooling is both abundant and great is the quality of resources available to developers.
Before we can analyse and lint Go code, we need to be able to parse it into logical components. Go provides some excellent core packages for parsing the language, notably go/parser and go/ast.
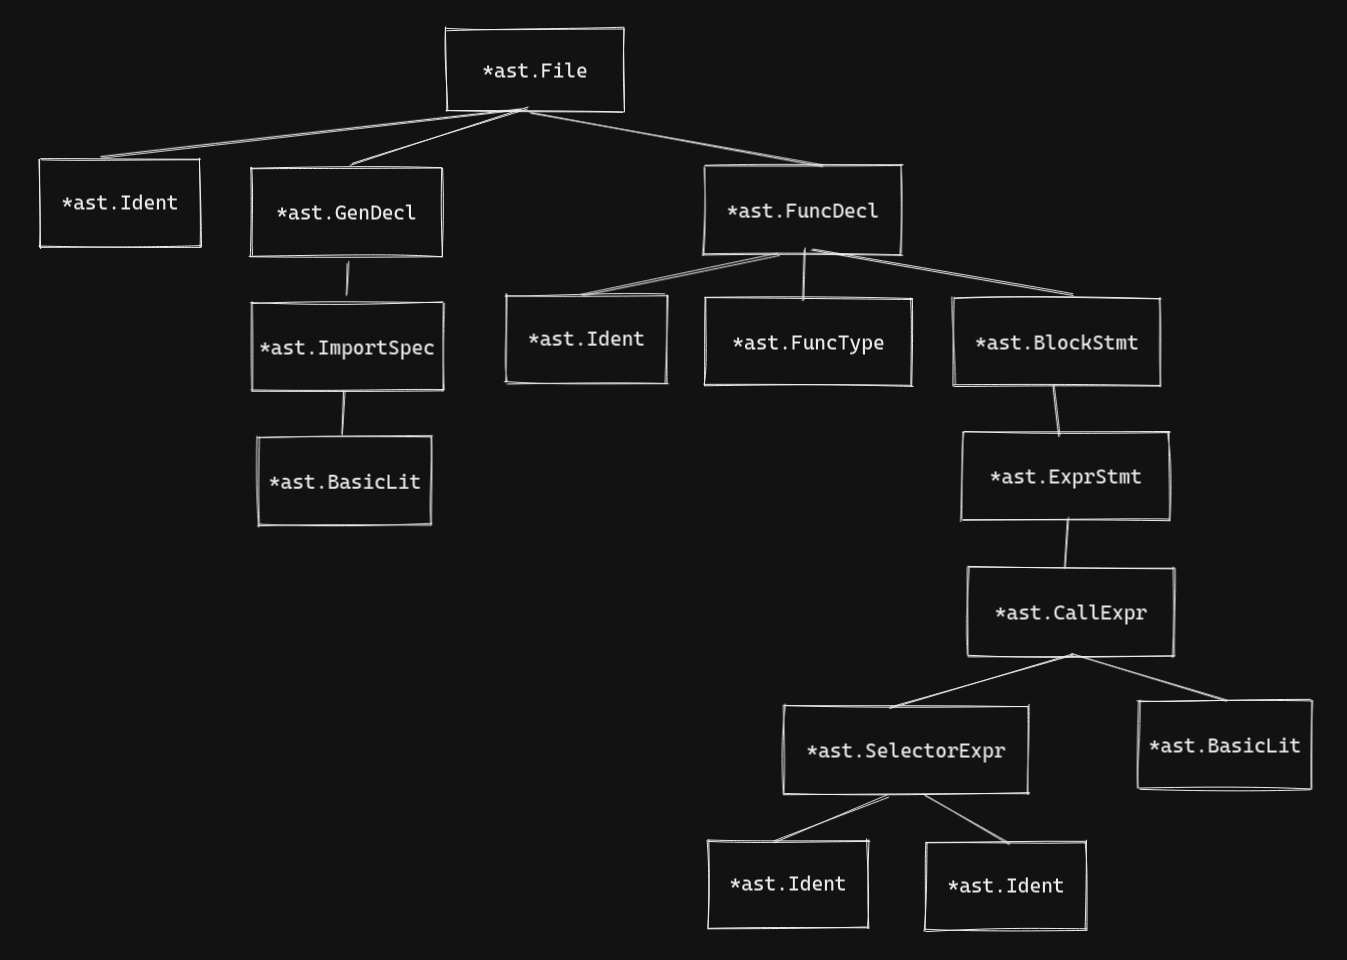
Using these, it’s quite easy to parse a Go source file into an AST. If you’re not familiar, an abstract syntax tree is a tree structure where each node represents a single construct from the source code.
Here’s an example of parsing a source file into an AST, and printing out each node of the AST recursively:
1
2
3
4
5
6
7
8
9
10
11
12
13
14
15
16
17
18
19
20
21
22
23
24
25
26
27
28
29
30
package main

import (
    "fmt"
    "go/ast"
    "go/parser"
    "go/token"
)

func main() {

    source := `package main

import "fmt"

func main() {
  fmt.Println("hello world!")
}
`

    parsed, err := parser.ParseFile(token.NewFileSet(), "", source, parser.AllErrors)
    if err != nil {
        panic(err)
    }

    ast.Inspect(parsed, func(node ast.Node) bool {
        fmt.Printf("%#v\n\n", node)
        return true
    })
}
The above takes the code:
1
2
3
4
5
6
7
package main

import "fmt"

func main() {
  fmt.Println("hello world!")
}
And turns it into the following (simplified) AST:

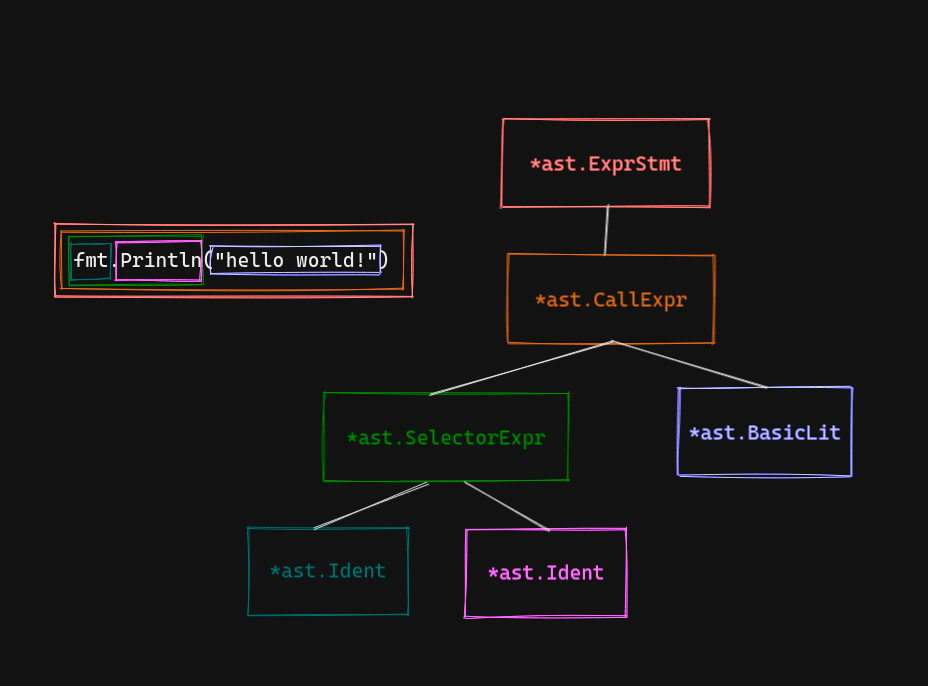
The line fmt.Println("hello world") is made up of the following nodes. I’ve colour-coded the diagram so it’s clearer which parts of the code are translated into which AST nodes.

You can run the code yourself to dig deeper if you like.
Once you begin to familiarise yourself with the AST, it becomes clear that you have the building blocks for a linter - and lots of other tools besides!
go/analysis
The go/analysis package provides an awesome toolkit for building a linter. It sets up command line flags and arguments, formats output, and even handles the reading of the source code for you. All that’s left for you to worry about is the linting itself. You simply need to flesh out an Analyzer struct and implement a function with the signature func(*goanalysis.Pass) (interface{}, error).
Here’s a complete example linter than looks for functions named ‘silly’:
1
2
3
4
5
6
7
8
9
10
11
12
13
14
15
16
17
18
19
20
21
22
23
24
25
26
27
package main

import (
  "go/ast"
  "golang.org/x/tools/go/analysis"
  "golang.org/x/tools/go/analysis/singlechecker"
)

func main() {
  singlechecker.Main(&analysis.Analyzer{
    Name: "mylinter",
    Doc:  "Checks for functions named 'silly'",
    Run: func(pass *analysis.Pass) (interface{}, error) {
      for _, file := range pass.Files {
        for _, declaration := range file.Decls {
          if function, ok := declaration.(*ast.FuncDecl); ok {
            if function.Name.Name == "silly" {
              pass.Reportf(function.Pos(), "function should not be named 'silly'")
            }
          }
        }
      }
      return nil, nil
    },
  })
}
Running the above without any arguments will spit out something like the following:
1
2
3
4
5
6
7
8
9
10
11
12
13
14
15
16
17
18
19
20
21
22
23
24
25
26
27
28
29
30
31
32
33
34
mylinter: Checks for functions named 'silly'

Usage: mylinter [-flag] [package]


Flags:
  -V    print version and exit
  -all
        no effect (deprecated)
  -c int
        display offending line with this many lines of context (default -1)
  -cpuprofile string
        write CPU profile to this file
  -debug string
        debug flags, any subset of "fpstv"
  -fix
        apply all suggested fixes
  -flags
        print analyzer flags in JSON
  -json
        emit JSON output
  -memprofile string
        write memory profile to this file
  -source
        no effect (deprecated)
  -tags string
        no effect (deprecated)
  -test
        indicates whether test files should be analyzed, too (default true)
  -trace string
        write trace log to this file
  -v    no effect (deprecated)
exit status 1
You can see that the go/analysis package has done all of the heavy lifting and set up the flags, args etc. for us!
Pointing it at a directory or file containing a function named silly will cause it to print out the offending line, like so:

We already have a working linter in 26 lines of Go!
Most of the code is spent looking through the AST for function declarations (*ast.FuncDecl). We can instead use the inspect package to do this for us. We need to add the inspect.Analyzer to the Requires property of our Analyzer struct, then we can use it like so:
1
2
3
4
5
6
7
8
9
10
11
12
13
14
15
16
17
18
19
20
21
22
23
24
25
26
27
28
29
package main

import (
    "go/ast"
    "golang.org/x/tools/go/analysis"
    "golang.org/x/tools/go/analysis/passes/inspect"
    "golang.org/x/tools/go/analysis/singlechecker"
    "golang.org/x/tools/go/ast/inspector"
)

func main() {
    singlechecker.Main(&analysis.Analyzer{
        Name:     "mylinter",
        Doc:      "Checks for functions named 'silly'",
        Requires: []*analysis.Analyzer{inspect.Analyzer},
        Run: func(pass *analysis.Pass) (interface{}, error) {
            insp := pass.ResultOf[inspect.Analyzer].(*inspector.Inspector)
            insp.Preorder([]ast.Node{
                (*ast.FuncDecl)(nil),
            }, func(n ast.Node) {
                if function := n.(*ast.FuncDecl); function.Name.Name == "silly" {
                    pass.Reportf(function.Pos(), "function should not be named 'silly'")
                }
            })
            return nil, nil
        },
    })
}
The inspector.Preorder function can be used to walk the AST and discover the specific node types we’re interested in - in this case *ast.FuncDecl, making the example a little cleaner.
Summary
Go linters are an incredibly powerful tool - especially so given the ease with which they can be developed!
Whilst they should never be a replacement for tests, I’ve found that custom linters can often highlight a problem much earlier in the development cycle, and are generally efficient to write for common bug types.
I hope you enjoyed these hints from my stint minting linters.
Comments powered by Disqus.